Homeowners Insurance Not Projected to Increase in Cost in 2024:
According to a study by Insurify, home insurance rates are expected to rise by 6% this year after a 20% increase over the last two years. However, the study indicates that in Missouri, the average cost of homeowners insurance in 2023 was $2,706 and for 2024 it’s projected to be $2,697. So, no increase in Missouri and actually a few bucks in savings.
Within Missouri, the cost of insurance varies by location. Here are a few examples of the average monthly quote for homeowners insurance for several cities within Missouri:
- Florissant – $206
- St. Charles – $186
- St. Joseph – $213
- St. Louis City – $232
- Springfield – $224
There are many factors that come into play regarding the cost of insurance beyond the location, such as the home’s replacement cost. This figure represents the cost to rebuild your home using similar materials and is influenced by several factors, including the age of your home, its square footage, architectural style, and the local rebuilding costs in your area. Coverage options also play a vital role. Homeowners who opt for additional coverages, such as protection for sewer lines, natural disasters, and high-value possessions, will generally see an increase in their insurance rates.
This is why it’s important to have a knowledgeable insurance agent and preferably one with access to coverage from many different companies to help you select the right company and coverage for your situation. A good place to start is STLBestInsuranceAgent.com, where you can find many helpful short videos about homeowners insurance, particularly from the standpoint of a homebuyer.
Most Expensive States for Home Insurance in 2024

12-Month Home Sales and Price Trend – Past 15 Years
(click on chart for live, interactive chart)

Based on the data from the recent ATTOM report on U.S. commercial foreclosures, there is a noticeable trend that highlights the challenges and changes in the commercial real estate market over the past decade. The report indicates a significant increase in commercial foreclosures, rising to 625 in March 2024 from a low of 141 in May 2020—a time characterized by pandemic-induced economic shocks and responsive fiscal interventions. This sharp rise represents a 117% year-over-year increase and underscores a broader economic narrative where, despite short-term stabilizations, long-term market corrections have been a constant presence.
States like California, New York, and Florida have borne the brunt of these fluctuations. For instance, California experienced a dramatic 405% increase from last year, showcasing how regional factors and state-specific economic conditions have influenced foreclosure rates. This analysis not only offers insights into the challenges faced by the commercial real estate market but also highlights the sector’s resilience and capacity to navigate through a continuum of economic cycles.
The recent spike in commercial foreclosures has raised questions about the interconnectedness of the commercial and residential real estate markets. Historically, these two sectors have shown some level of correlation, as economic factors affecting businesses often spill over into the residential sphere. For instance, a downturn in commercial real estate can lead to job losses and reduced consumer spending, which in turn can soften the residential market. However, the current trends suggest a more complex relationship, with the residential market remaining relatively stable despite significant upheavals in commercial real estate. In the coming months we’ll see if that trend continues.
US Commerical Foreclosures 2014 – 2024 (Chart)
")
Slowest Selling Zip Codes in St Louis
(click on table for complete list with current data)

Since the National Association of Realtors (NAR) and the plaintiffs in the following lawsuits—Christopher Moehrl v. The National Association of Realtors et al., Rhonda Burnett (originally Sitzer) v. The National Association of Realtors et al., Dawin Niel Umpa v. The National Association of Realtors, et al., and Don Gibson v. The National Association of Realtors—reached a settlement agreement on March 15, 2024, which is still pending court approval and thus preliminary at this point, the topic has dominated industry conversations. The focus of these lawsuits on buyer’s agent commissions has attracted more media attention since mid-March than it seems to have received in the over 40 years I’ve been in the business before that. Don’t get me wrong, I’m not saying all this attention is bad. In fact, I believe it is beneficial. I’ve long advocated for educating consumers, feeling that the more home buyers and sellers know, the better decisions they can make. This is why I’m rapidly approaching the milestone of 3,000 articles on the topic of real estate in St. Louis on this site.
Now, I don’t do this solely for altruistic reasons; sharing the information and knowledge I’ve gained either through experience or research is also self-serving. As a broker-owner of MORE, REALTORS®, I’ve put forth just as much effort in sharing knowledge with our agents, and I am blessed to be surrounded by real estate professionals who are as eager as I am to increase their knowledge and hone their skills to better serve clients. Here’s the reward for me: informed and knowledgeable consumers seek out better and more professional agents, like the ones we’re in business with, creating a win-win situation.
Having said all that, while the attention from the media is beneficial, unfortunately, there is a lot of incorrect information out there and assertions being made that don’t seem to be based on facts, but rather on opinion. Oh yes, I have opinions too, plenty of them, many of which are shared on this site, but to the extent possible, I try to base them on facts and include the sources of my opinions.
Background: George Sheetz was mandated to pay a $23,420 traffic impact fee as a condition for obtaining a residential building permit, which he contested as an unlawful exaction under the Takings Clause.
Court’s Decision: The Supreme Court, in an opinion delivered by Justice Barrett, vacated the ruling of the California Court of Appeal. The decision clarified that the Takings Clause does not differentiate between legislative and administrative land-use permit conditions, reinforcing property rights protections against arbitrary government exactions.
Legal Principles Invoked: The Court applied the tests from Nollan v. California Coastal Comm’n and Dolan v. City of Tigard, emphasizing that permit conditions must both have an “essential nexus” to the government’s land-use interest and be “roughly proportional” to the impacts of the proposed development.
Impact and Precedent: The ruling underscores the necessity for governmental authorities, whether legislative or administrative, to adhere strictly to constitutional principles when imposing conditions on building permits. This decision is a significant affirmation of property rights, setting a precedent that both legislative and administrative exactions are subject to the same constitutional scrutiny.
This decision marks a critical juncture in property law, reaffirming the Supreme Court’s commitment to protecting individual property rights against overreach by local governments.
Supreme Court Decision: SHEETZ v. COUNTY OF EL DORADO
(Click below to view the entire decision)

What are the fastest-selling school districts in the St. Louis metro area currently?
As of today, the list below, available exclusively from MORE, REALTORS®, indicates that the Windsor C-1 School District in Jefferson County is the fastest-selling, with homes staying on the market for an average of just 5 days. It is followed by Smithton DIST 130 in Illinois, with an average of 6 days on the market, and Sunrise R-IX in Jefferson County, taking third place with 7 days. St. Clair County in Illinois claims five of the top ten spots for the fastest-selling school districts, followed by Jefferson County with three. It should be noted that smaller school districts, with fewer homes on the market, may have an advantage over larger districts with more extensive inventory.
Top 10 Fastest Selling School Districts in the St Louis Metro Area
(click on list below for current, complete list)

During the most recent 12-month period, homes in the St. Louis metro area sold for a median price of $170 per foot, marking an increase of about 7.5% from the same period a year ago.
St Louis MSA 12-Month Home Sales and Price Trend – Past 15 Years (Chart)
(click on chart for live, interactive chart)
")
Key takeaways from this list include:
- Huntleigh dominates with the highest average sale price of $2,097,249 and impressively quick transactions, with homes spending an average of just 20 days on the market. It’s important to note that these figures are based on a limited sample of only four home sales.
- Frontenac and Town and Country are not far behind, boasting substantial average prices of $1,436,364 and $1,389,021, respectively. The volume of sales in these areas—46 and 68 homes sold—points to a healthy and active market.
- Clayton and Ladue marry luxury with lively market activity, seeing 103 and 148 homes sold at steep average prices of $1,372,398 and $1,330,002, respectively.
Additional cities such as Westwood, Josephville, Town and Country, and Clarkson Valley also feature on the list, each contributing unique market traits but collectively underscoring the strong demand for high-end residential properties in the area.
St Louis MSA’s Most Expensive Cities-Avg Price-Homes Sold In Past Year
(click on list for current, complete list)

Joel Kan, MBA’s Vice President and Deputy Chief Economist, attributed the rising rates to the Federal Reserve’s cautious stance on adjusting policy amidst persistent inflation and resilient economic indicators, including strong employment data. Despite the unfavorable rate environment, the demand for refinancing, especially VA refinancing, remained robust.
Other notable trends include a decrease in average loan sizes, with purchase loan sizes—often viewed as a proxy for home prices—dropping to $449,400 from $453,000. Additionally, there was a shift in the composition of mortgage applications, with increases in FHA and VA loan shares.
So, what explains the rising number of homeowners refinancing their mortgages even with rising mortgage interest rates? There are numerous reports indicating that many homeowners across the country are becoming cash-strapped and having a difficult time paying bills, thus resorting to pulling out equity from their homes, even if it means accepting a higher interest rate. I’ve also observed reports indicating that consumer credit card debt is at historically high levels, with interest rates on this debt being astronomical. This situation is prompting people to refinance their home loans again, even at higher rates, because even though their mortgage may be at a higher rate, it still appears to be a bargain compared to the 27 or 28% on a credit card. I haven’t seen enough verifiable data to confirm if either of these situations is true, but both are plausible.
Refinance Index vs 30 Yr Fixed Mortgage Chart
(click on image for live, interactive chart)
 Hous
Hous
The ebb and flow of St. Louis’s real estate market are linked to the broader economic currents, and recent weeks have witnessed a significant uptick in mortgage interest rates. In the video below, Traci Everman, Senior Mortgage Banker with Flat Branch Home Loans, does a fantastic job of explaining what is happening and why. Below the video are some highlights and a recap.

Here are are few highlights of what Traci’s covers in the video:
Recent Economic Impacts on Mortgage Rates:
- Economic reports released over the past day have precipitated a downturn in the bond market and a subsequent rise in interest rates. This movement stems from inflationary pressures, which erode the value of long-term investments like mortgage-backed securities.
Analyzing PCE Inflation and Jobs Reports:
- Key economic indicators such as the PCE report, which reflects inflation sans food and energy costs, revealed a 0.3% increase, signaling a direction contrary to the market’s desires. Furthermore, the employment data, despite being a bearer of good tidings on job creations, did not spell out positive news for the bond market.
Current State of Mortgage-Backed Securities:
- Currently, the mortgage-backed securities market is taking a hit, down 88 basis points, leading to a predicted quarter percent increase in interest rates between yesterday and today. This fluctuation reminds us of the volatility that peaked in October 2023.
How Recent Trends May Affect Future Rates:
- The Federal Reserve’s stance and upcoming meetings are pivotal. While rate cuts were anticipated, the outcome was status quo, leaving predictions for future rate cuts in 2024 uncertain. Inflation, driven by rising oil prices and other factors such as soaring auto insurance premiums, continues to play a crucial role.
Conclusion: Staying Informed on Market Changes:
As Traci Everman sums up the market update, it’s clear that keeping a close eye on inflation and Fed decisions is crucial for anyone involved in real estate. With potential rate cuts on the horizon, the coming quarters could be crucial for buyers and sellers in St. Louis.
For a more detailed dive into what this means for your home buying or selling decisions, stay connected with St. Louis Real Estate News. Stay informed.
The St. Louis MSA residential real estate market is experiencing a phase of transformation. While the sales volume has seen a downturn, median sale prices have held steady, indicating a resilient market underpinned by solid demand. The complete STL Market Reports for the entire metro area as a whole, as well as the major counties, are available exclusively from MORE, REALTORS® and are below.
Key Findings:
- Sales Volume Decline: The St. Louis MSA experienced a 9.30% decrease in the number of homes sold during the 12-month period ending March 31, 2024, compared to the previous year.
- Median Sold Price Growth: Despite decreased sales, median sold prices rose by 2.40% from $248,000 to $253,950 during the same period.
- Price Per Square Foot (PPSF): The PPSF of current listings is 3.74% than the PPSF of homes that sold during the prior 12-months. This suggests an adjustment in the market with current listings being priced lower than what was sold in the past year.
- Inventory and Supply: There is currently a 1.07 months supply of homes for sale, indicating a tight inventory reflective of a seller’s market.
- Median days on the market: The median time on the market of current listings is just 22 days, showing homes are selling relatively quickly.
County Highlights:
- St. Louis City and St Louis County:
- A decrease of -5.14% in homes sold year-over-year.
- A reduction in median sold price by -1.21%.
- A significant drop in PPSF for current listings by -15.93% compared to the last 12 months.
- St. Charles County:
- The number of homes sold dropped by -14.64%.
- Median sold prices increased by 5.97%.
- PPSF for current listings increased by 12.61%, signaling strong market growth.
- Franklin County:
- A decrease of -9.72% in homes sold year-over-year.
- Median sold prices increased by 9.09%.
- PPSF for current listings rose by 8.86%.
- Jefferson County:
- The number of homes sold decreased by -16.63%.
- An increase in median sold prices by 4.02%.
- A substantial increase in PPSF for current listings by 12.63%.
Market Implications:
The St. Louis MSA real estate market is currently defined by a decrease in the number of homes sold but a general uptrend in prices. The PPSF analysis reveals a market correction, yet the trend suggests prices might increase shortly.
- For Sellers: The current market presents an opportunity due to low inventory levels and a consequent seller’s market, indicated by the low months’ supply.
- For Buyers: The decreased competition and market adjustment could benefit buyers, yet they should be mindful of the resilient pricing trends.
The real estate landscape in the St. Louis metro requires careful navigation, with sellers possibly leveraging the low supply and buyers staying cautious of the potential for increasing prices. Stay informed with St. Louis Real Estate News for ongoing analysis and insights into local market trends.
Continue reading “St. Louis Area Residential Real Estate Market Report For March 2024“
St Louis New Home Building Permits – February 2024
(click on table below for page with live charts showing additional permit data)
A Recurring Theme in Real Estate Litigation
The intertwining of Realtor association membership and MLS access has been a contentious issue, sparking several lawsuits over the years. This relationship, critics argue, creates barriers to competition and innovation in the real estate market.
Significant Legal Precedents
A pivotal moment in this ongoing discourse was the “Thompson v. Metropolitan Multi-List, Inc. Lawsuit,” where the 11th Federal Circuit Court of Appeals in 1991 ruled against restricting MLS access to Realtor members in Georgia. This case set a significant precedent, affirming that such practices could violate federal antitrust laws if the MLS wielded “market power” in the relevant geographic market.
Further complicating the landscape, California courts in the late 1970s found similar restrictions in violation of state antitrust statutes, thereby requiring Realtor associations in the state to open their MLS to non-members.
Looking Ahead
As the real estate industry continues to evolve, the relationship between REALTOR® associations and MLS access remains a focal point for legal scrutiny and industry reform. The implications of these legal battles extend beyond the courtroom, potentially shaping the future of real estate transactions, market competition, and consumer choice.
While the NAR settlement and recent lawsuits highlight different facets of the industry’s challenges, they collectively underscore a broader call for transparency, fairness, and innovation in real estate practices.
Conclusion
The dialogue surrounding MLS access and REALTOR® association membership is far from concluded. As legal actions continue to unfold, stakeholders across the real estate spectrum must remain vigilant and adaptable to the changing regulatory and business environment. At MORE, REALTORS®, we’re keenly aware of these potential shifts and are proactively strategizing to ensure our agents are well-positioned to navigate any changes that may arise. Our focus remains steadfast on providing exceptional service to our clients, irrespective of the evolving industry dynamics. As always, we’re committed to transparency, adaptability, and unwavering professionalism.
The Department of Justice (DOJ), through its Antitrust Division, initiated an investigation into NAR’s policies, which culminated in a settlement in November 2020. This settlement aimed to address four out of six policies identified by the DOJ as potentially anticompetitive. Crucially, it also included the issuance of a closing letter by the DOJ, indicating the closure of its investigation into two key NAR policies: the “Clear Cooperation Policy” and the “Participation Rule.” These policies relate to the operation of multiple-listing services (MLSs) and the commission structure within real estate transactions, respectively.
However, in a dramatic shift, the DOJ reopened its investigation into these policies in July 2021, leading to a legal challenge by NAR. NAR argued that the DOJ’s action breached the settlement agreement, which, in their view, included an implicit assurance against reopening the investigation into the specified policies.
The Appeals Court, in its decision, highlighted the legal nuances of the settlement agreement and the scope of the DOJ’s commitments. The court concluded that the settlement did not preclude the DOJ from reopening its investigation. This decision not only emphasizes the DOJ’s ongoing authority to regulate and scrutinize industry practices for anticompetitive behavior but also signals to real estate professionals the importance of adaptive compliance with evolving regulatory landscapes.
This ruling carries profound implications for the real estate industry, reinforcing the principle that regulatory oversight is a dynamic process, subject to revision and reassessment in light of new information or changing circumstances. For homebuyers and homesellers, the decision underscores the government’s commitment to ensuring fair and competitive practices within the real estate market, aiming to protect consumer interests and promote market transparency.
United States Court of Appeals Judgement – NAR vs United States of America
(click on image below to access entire judgment)

The Core Allegations:
At the heart of Wang’s lawsuit is an objection to how MLS access — a critical tool for buying and selling properties — is tied to membership in the NAR. This arrangement, according to the lawsuit, perpetuates a non-competitive environment where commission rates are kept uniformly high due to lack of market-driven pricing. This system, the plaintiff argues, indirectly forces buyers to absorb the cost of buyer’s agent commissions, which are embedded in home purchase prices, in violation of antitrust laws.
Legal Objectives:
- Seeking Class Action: The lawsuit aims to achieve class action status, offering representation to a broad swath of home buyers potentially affected by the described practices.
- Injunctive Relief and Damages: Beyond seeking damages for alleged overpayments, the complaint calls for judicial intervention to prohibit the continuation of tying MLS access to NAR membership, alongside the existing commission practices.
Industry Implications:
This lawsuit adds another layer to the ongoing discourse on real estate commission models, specifically targeting the structures that underpin agent access to essential market information. By challenging the linkage of MLS access to NAR membership, the case prompts a reevaluation of how such policies impact competition, pricing, and ultimately, consumer choice.
Reflecting on the Bigger Picture:
From an insider perspective, this case illuminates the complex interplay between professional associations, access to market information, and how commissions are structured. It calls into question whether current practices best serve the market’s needs or if they inadvertently constrain competition and innovation. As the real estate industry continues to grapple with these issues, the outcome of this lawsuit could have significant repercussions, potentially catalyzing shifts towards more transparent and consumer-friendly practices.
Hao Zhe Wang v The National Association of REALTORS®
(click below to view the entire complaint)

, the fastest selling zip code in the area is 63070 in Jefferson County, Missouri where the current average days on market for active listings is just 12 days. Close behind in second place is 63040 in St. Louis County with 9 listings averaging 15 DOM. Rounding out the top five are 63134 (St. Louis County, 16 DOM), 63038 (St. Louis County, 17 DOM), and 63052 (Jefferson County, 20 DOM). The City of St. Louis makes its first appearance at #9 with 63021 and its 17 listings averaging 27 DOM.
Notably, 8 of the top 10 fastest-selling zips are located in Missouri counties, with just two from the Illinois side of the MSA – 62254 in St. Clair County at #14 and 62035 in Madison County at #15.
Fastest Selling Zip Codes in St Louis
(click on table for complete list with current data)
Scorecard on December Predictions: These numbers suggest a relatively stable market, albeit with a slight variance from the predicted downward trend. The sales in February exceeded expectations, hinting at a possibly more dynamic market than initially forecasted. The March figure aligns closely with the expected summer peak. This rapid ascent in prices suggests a stronger upward momentum in the housing market than forecasted, possibly reflecting tighter inventory or increased demand. Updated Forecast for 2024: A Word of Caution: In summary, the St. Louis housing market is showing signs of robust activity and price growth in the first quarter of 2024. Buyers and sellers should stay informed and agile, ready to adjust to the dynamic market conditions. (click on chart for live, interactive chart) The Council of Multiple Listing Services (CMLS), representing over 200 Multiple Listing Services nationwide, has filed a brief supporting the settlement reached between the parties in the lawsuit against MLS Property Information Network (MLS PIN). While this is not the settlement announced last week by the National Association of REALTORS® (NAR), it involves one of the several lawsuits tied to the NAR settlement. CMLS filed their brief in response to the one filed by the Department of Justice (DOJ) in February, which opposed the MLS PIN settlement, arguing that it did not go far enough to change existing practices to lower commissions and increase competition. In their brief, CMLS points to data showing that a similar rule change adopted by the Northwest Multiple Listing Service (NWMLS) in 2019 saved homebuyers an average of $1,000 per transaction by reducing buyer agent commissions. The DOJ has opposed the MLS PIN settlement, asserting that it would not meaningfully benefit consumers. CMLS contends that the DOJ’s analysis is flawed and that its preferred solution – an outright ban on buyer agent compensation – could disrupt the real estate market and harm consumers. It is doubtful that the judge will make a ruling in the MLS PIN case while the NAR settlement is pending. However, the briefs filed by the DOJ and CMLS in the MLS PIN lawsuit may have an impact on the decision regarding the NAR settlement. (click to view entire brief)
One of the issues receiving significant attention following the announcement of the REALTOR® commission suit settlement is the topic of buyer commissions, specifically regarding whether a buyer has to pay them and how lenders will treat the commissions. In a recent letter to the Federal Housing Finance Agency (FHFA), Federal Housing Administration (FHA), Fannie Mae, and Freddie Mac, NAR and MBA sought confirmation on the treatment of buyer agent commissions following a proposed settlement agreement in the Burnett et al and Moehrl et al cases. What does this mean for homebuyers? Under the settlement, cooperative commissions will no longer be displayed on Multiple Listing Services (MLS), but listing brokers and sellers will still be able to offer compensation for buyer broker services through other means. Additionally, the settlement does not prohibit home sellers from paying buyer agent commissions directly. NAR and MBA believe that FHA and Government-Sponsored Enterprise (GSE) policies should continue to exclude seller or listing agent payments of buyer agents’ commissions from Interested Party Contributions (IPCs). IPCs are concessions from the seller to the buyer for items traditionally paid by the buyer, such as loan closing costs or rate buy-downs. Maintaining this practice is essential to ensure that the flow of mortgage capital to homebuyers remains uninterrupted. As a homeowner or potential buyer, it’s important to stay informed about these developments and how they may impact your buying or selling process. NAR and MBA have requested confirmation from the FHFA, FHA, Fannie Mae, and Freddie Mac as soon as possible to prevent any confusion and potential disruptions that may cost you money or even jeopardize your home purchase. (click to view entire letter) The St. Louis Metro residential real estate market in 2024 is showcasing diverse trends, indicating an evolving landscape for buyers, sellers, and industry professionals. The latest data, detailed in the STL Market Report exclusively from MORE, REALTORS®, offers a snapshot of these dynamics. Contrasting Sales Trends: Home Value Resilience: Price Per Square Foot (PPSF) Analysis: Signs of Market Adjustment: Inventory and Supply Dynamics: The St. Louis Metro real estate market’s recent performance, detailed in the report shown below, reveals a complex picture. Sales volume is down, yet home values are resilient, even with the lower PPSF for current listings. This discrepancy suggests that, although the pace of sales has slowed, the demand remains robust enough to support current price levels. Sellers might see this as an opportunity, given the scarcity of inventory and the seller’s market indicated by the low months’ supply. However, buyers may benefit from less competition, even as they face persistent price strength. It’s a pivotal time for the market, and those involved will need to navigate these mixed signals with strategic planning and sound advice from experienced real estate professionals. Stay tuned to St. Louis Real Estate News for detailed analyses and updates on our local market trends. Eligibility Criteria and Key Details: Moehrl v. NAR Eligibility: Burnett et al. v. NAR Eligibility: Next Steps for Eligible Home Sellers: Even the most informed of us agents and brokers out here are scratching our heads because the lawsuit changed gears so quickly. Nobody really knows exactly how it’s all going to work yet. And those flashy headlines? Well, they’re a bit misleading because the truth is, nobody knows for sure if commissions will go down or up. I can easily make a case for both up and down. Here’s the deal: if this settlement gets approved by the courts, sellers won’t be able to advertise agent commissions anymore. But they can still offer them, just not in their listing. And for buyers, they’ll have to sign a written agreement with an agent if they want representation—like Missouri License Law has said for over 20 years. But before you get too excited about saving some cash, there are a few things you should consider. For sellers, allowing your listing broker to offer commissions might still be in your best interest. And buyers, well, going it alone might not be as easy as it sounds. You’ll still have to do all the legwork and negotiations yourself AND the biggest risk in, likely, your largest transaction: you don’t know what you don’t know. Remember, unless the listing agent is hired as a transaction broker, the listing agent represents the seller first and foremost. If they are a transaction broker, they cannot give you advice. So, while these changes could be a big deal, the reality is, we’re all still waiting to see how it shakes out. If you’re feeling curious or worried about what’s coming, your best bet is to chat with your trusted real estate advisor. They’ll be able to give you the lowdown and keep you in the loop as things progress. And it they can’t, the agents and brokers here at MORE, REALTORS ® certainly can. We’ve been covering this issue since 2019. Bottom line? Don’t believe all the hype just yet. Real estate, in general, is a wild card. While we’ll just have to wait and see how it all plays out, just know that we here at MORE, REALTORS® have been on top of this issue for years and have been adjusting accordingly. Oh yeah, remember, you can keep your doctor too. 😉 Hurdles include the court holding a fairness hearing to assess if the proposed settlement is fair, reasonable, and adequate for class members. This hearing allows class members to express objections and concerns. Moreover, antitrust class action lawsuits like this one, which impact market competition and consumer protection, prompt the court to consider broader public interest implications when approving settlements. This attention often draws input from professional associations, consumer organizations, and, as seen in the MLS PIN suit, the United States, giving their opinion on the settlement’s sufficiency. Ultimately, the decision rests with the judge, who will consider all these aspects. I should have led with this, but I am not an attorney, and this is not legal advice. As a real estate broker with over four decades in the residential real estate industry, I have a keen interest in the legal facets of our business and the issues at hand, closely following these cases since 2019. I’m a staunch advocate for transparency and education for real estate professionals, clients, and everyone involved. The more accurate knowledge consumers have about buying and selling a home, the better choices they can make. This is especially true when selecting a real estate agent, as not all are created equal. Back to the matter at hand. What will the DOJ say about the NAR Settlement? Assuming the Department of Justice files an amicus brief in this case, as they did with MLS PIN—a safe assumption, in my view—it’s intriguing to speculate on their comments regarding this settlement. While I lack a crystal ball or insider information, considering the DOJ’s Statement of Interest filed on February 15, 2024, in Nosalek V. MLS Property Information Network (MLS PIN), and assuming their opinion hasn’t shifted in the last five weeks, offers a logical foundation for analysis. I sought an objective analysis from my trusty AI Assistant, which, for the sake of this discussion, is an outstanding attorney specializing in antitrust law (or at least that is what I’ve told it to think of itself as). Applying the DOJ’s recent statement to this settlement, here’s what it suggests the DOJ might say: In conclusion, despite offering more monetary relief and practice changes than the MLS PIN agreement, the settlement inadequately addresses fundamental antitrust issues. The court must weigh whether the settlement’s limited benefits justify the broad release of claims and the potential chilling effect on future antitrust enforcement. As in the MLS PIN case, a more effective remedy might prohibit the seller-paid buyer broker commission model, fostering genuine market competition. This is all based on publicly available information. We must wait to see the DOJ’s stance and whether the judge deems the settlement adequate. Ragan assures homebuyers, “Aluminum wiring is not necessarily a bad thing,” explaining that “if things are done correctly using the aluminum wiring, that it’s not dangerous.” He addresses the common fear surrounding aluminum wiring, which stems from its susceptibility to oxidation and the associated risks of overheating and fire hazards in older installations from the 1970s. However, he clarifies that with the correct installation and maintenance procedures in place, aluminum wiring is not inherently dangerous. Key to the safe use of aluminum wiring is the application of specific products like deoxidizing agents and the use of aluminum-rated devices, which prevent oxidation and ensure secure connections. Moreover, Ragan highlights budget-friendly solutions for addressing aluminum wiring concerns, such as aluminum-rated connections or AlumiConn® connectors, whereby “you can significantly save money by going with the connections… less than half the cost by going through and redoing all the connections.” He strongly recommends that buyers considering a property with aluminum wiring engage a licensed electrician familiar with these issues to conduct a thorough inspection, thereby ensuring the wiring’s integrity and compliance with safety standards. This dialogue not only educates homebuyers about the realities of aluminum wiring but also reassures them that, with proper attention and maintenance, homes equipped with aluminum wiring can be a safe, viable option. He says, “I would have no problem buying an aluminum wired house if the things we talked about were done correctly.” Ragan’s expertise offers practical guidance for navigating concerns related to aluminum wiring, empowering homebuyers to make informed decisions about their potential purchases. Key Points of the NAR Settlement Agreement What This Means for St. Louis Real estate agents and brokerages in our region will need to adapt to these changes, focusing on educating clients about compensation options and ensuring compliance with the new rules. At MORE, REALTORS®, we’ve been preparing for these shifts and are ready to guide our clients through the evolving landscape. The full text of the NAR settlement agreement can be found below. As always, I’ll continue to keep you informed about how these developments impact our local market. The Proposed NAR Settlement Agreement (click on image to view entire agreement) Kevin Sears, NAR President This morning, Kevin Sears, President of the National Association of Realtors (NAR), unveiled a proposed settlement designed to bring to a close the contentious litigation surrounding broker commissions, a move that could significantly alter the landscape of the real estate industry. This development comes on the heels of the Sitzer-Burnett verdict, which cast the traditional practices of real estate professionals, particularly those concerning hiring and compensation methods, into the spotlight, sparking a series of lawsuits and raising questions about the future of the industry. A Closer Look at the Proposed Settlement The core aim of the proposed settlement is to resolve the ongoing litigation against NAR, its members, and associated real estate entities by addressing the claims related to broker commissions. Key components of the settlement include: Kevin Sears Weighs In Sears articulated the objectives of the settlement, stating, “This proposed settlement achieves our goals to reduce strain on our members and chart a path forward for the industry.” He further emphasized the industry’s resilience and adaptability, expressing confidence that the agreement “allows us to move forward, preserving the right to real property for all.” MORE, REALTORS® Prepared for the Future Yes, this might come off as a shameless plug, but it would be a disservice not to mention how myself, alongside our brokerage’s leadership team, brokers, and agents, have been proactively preparing for the anticipated changes. We’ve delved deep into the issues raised by these lawsuits, identifying practices in need of rectification, regardless of the legal outcomes. Thus, while the shift away from MLS compensation offerings may catch many off guard, our team stands ready. We’re equipped to demystify the compensation process for our clients transparently, dedicating our focus to their needs. Discover more about our exceptional team at MORERealtors.com. The Proposed NAR Settlement Agreement (click on image to view entire agreement) Here in Missouri, MV Realty has faced legal action from Missouri State Attorney General, Andrew Bailey who, earlier this year, filed suit against MV Realty “for its deceptive practices in marketing its services to Missouri homeowners.” In a press release about this suit, Attorney General Bailey stated “I will enforce the laws as written and defend innocent Missourians from being ripped off” and the he was “proud of the work done by our Consumer Protection Unit to obtain justice for victims in this case.” The suit filed by Attorney General Bailey alleges that “MV Realty, in violation of Missouri law, paid homeowners a tiny percentage of the value of their homes in exchange for a promise that the homeowner would use MV Realty as their brokers when they sold their homes.” Attorney General Bailey’s statement about the suit filed goes on to to state that “the petition further alleges that MV Realty failed to tell the homeowners that the contract would be enforceable against their heirs after their death, that the contract bound them for 40 years, and that it would result in a lien being placed on their homes. In some instances, MV Realty falsely told homeowners that MV Realty would not place a lien on their homes, and that they would never have to pay the money back.” Attorney General Bailey is asking the court to order that the liens be removed, that the agreements are void and unenforceable and to provide restitution to consumers who have been charged unlawful cancellation penalties and then finally to order that MV Realty pay fines and penalties, including $213 million in penalties for calling homeowners on the No Call list. MV Realty operated in several states and appears to have complaints mounting in many of them from various parties. In late 2022 the Florida Attorney General’s Office filed a lawsuit against MV Realty, accusing the company of violating the state’s Deceptive and Unfair Trade Practices Act. The lawsuit sought to enjoin MV Realty from engaging in further deceptive practices and to obtain restitution for affected homeowners. As legal challenges and claims against MV Realty accumulated, MV Realty Holdings and approximately two dozen affiliated companies sought Chapter 11 bankruptcy protection in September 2023. This move automatically initiates a “stay” on existing lawsuits and claims, effectively pausing them. These actions remain on hold until the bankruptcy court either grants relief from the stay or the bankruptcy case concludes through dismissal or discharge. Currently, with the bankruptcy cases still active, proceedings are largely at a standstill. However, indications suggest the bankruptcy court may soon make further developments or progress. Homeowners, including those in the St. Louis area, who entered agreements with MV Realty, face uncertainty regarding their property liens and seek clarity on their standing as the legal and bankruptcy proceedings progress. The purpose of sharing this information is to educate homeowners on the importance of thoroughly understanding any agreements concerning their homes, advocating for informed decision-making with the support of qualified professionals. In our real estate practice at MORE, REALTORS®, we emphasize education and leverage a network of trusted professionals to guide homeowners, reflecting our commitment to looking out for our clients best interest and to equipping our clients to make informed decisions. The St. Louis Metro Area saw a continued population decline according to the latest U.S. Census Bureau estimates, which show the region’s population decreasing from 2,820,285 in April 2020 to 2,796,999 as of July 2023. This represents a loss of 23,286 residents, or a 0.83% decrease over the three-year period. Looking at the one-year change, the St. Louis MSA population fell by 3,246, or 0.12%, from 2,800,245 in July 2022 to 2,796,999 in July 2023. Despite these decreases, St. Louis maintained its position as the 21st largest MSA nationally from 2020 to 2023. Drilling down to the county level reveals that the population decline was not evenly distributed across the MSA. St. Louis County, the most populous county in the metro area, saw its population drop from 1,004,305 in April 2020 to 987,059 in July 2023, a loss of 17,246 residents or a 1.72% decrease. The City of St. Louis experienced an even sharper decline, falling from 301,565 to 281,754 over the same period, a decrease of 19,811 or 6.57%. In contrast, some outlying counties in the MSA saw population growth. St. Charles County, the second most populous county in the region, grew from 405,271 in April 2020 to 416,659 in July 2023, an increase of 11,388 or 2.81%. Jefferson County’s population also increased, albeit more modestly, from 226,569 to 231,230, a gain of 4,661 or 2.06%. Other Missouri counties in the MSA saw mixed results. Franklin County’s population rose from 104,689 to 106,404, an increase of 1,715 or 1.64%, while Lincoln County saw strong growth, increasing from 59,578 to 64,699, a gain of 5,121 or 8.59%. However, Warren County had a more moderate increase from 35,528 to 37,806, a growth of 2,278 or 6.41%. In Illinois, the counties included in the St. Louis MSA also experienced population declines. Madison County’s population fell from 269,484 to 266,368, a loss of 3,116 or 1.16%, while St. Clair County saw a decline from 259,686 to 253,292, a decrease of 6,394 or 2.46%. Monroe County, however, remained relatively stable, with a slight increase of 4 residents or 0.02%, from 34,962 to 34,966. The data shows that the St. Louis MSA’s overall population decline of 0.83% from 2020 to 2023 was driven largely by significant decreases in the core city of St. Louis (-6.57%) and St. Louis County (-1.72%), as well as declines in the Illinois counties of Madison (-1.16%) and St. Clair (-2.46%). While some suburban and exurban counties experienced population growth, such as Lincoln County (8.59%) and St. Charles County (2.81%), it was not enough to offset the losses in the urban core and Illinois portion of the MSA. This pattern of population shifts from urban to suburban/exurban areas within metro areas has been observed in many other regions across the country in recent years. St Louis MSA Population Change 2020-2023 By County The St. Louis Metropolitan Area continues to enjoy a fairly fast-paced sellers real estate market, with certain zip codes standing out for selling even faster than the current norm. According to the report below, available exclusively from MORE, REALTORS®, homes in the top 30 zip codes are selling at an impressive rate, with average days on market ranging from just 2 to 24 days. Other notable fast-selling areas include zip codes in Warren County, Missouri (63380), St. Louis City, Missouri (63141, 63109, 63147, 63139), and St. Charles County, Missouri (63304, 63385, 63367, 63376). These areas demonstrate the high demand and quick turnover that characterize the St. Louis real estate market. For buyers, this data highlights the need to act quickly when a desirable property becomes available. Sellers, on the other hand, can take advantage of the fast-paced market to sell their homes efficiently and potentially secure a favorable price. Understanding the dynamics of these fast-selling zip codes is crucial for anyone navigating the St. Louis real estate landscape. By staying informed and working with experienced professionals, both buyers and sellers can make the most of the opportunities presented by this thriving market. Want to meet some of St Louis’ finest agents? Then check them out here. (Click on table below to see current, live and complete list)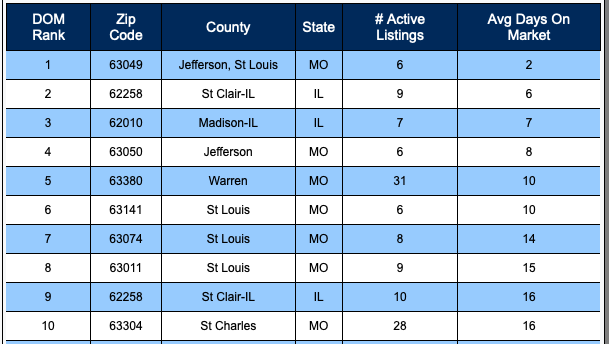
Given the trends observed in the first quarter, I am revising my forecast for the St. Louis real estate market in 2024 as follows:
As always, this forecast is contingent on prevailing economic conditions, including interest rates and inflation trends. Significant deviations in these or other macroeconomic factors could impact the market differently than expected.
St Louis 5-County 12-Month Home Sales and Price Trend

CMLS Amicus Brief

The MBA and NAR Letter


 You’ve probably heard about these changes happening with real estate commissions, right? It’s been all over the news lately. You might have seen headlines like “Real estate commissions are being slashed!” or “Selling your house will now be less expensive!” Sounds pretty exciting, doesn’t it? And the media has a great track record, right? Let me tell you, there’s a lot more to it than meets the eye.
 Last week, I wrote an article about the settlement reached by the National Association of REALTORS® in pending litigation concerning buyer agency compensation. This includes the “Sitzer” (now Burnett), “Moehrl,” and “MLS PIN” suits, among others. As mentioned, this is an early stage in the process; the settlement agreement, although agreed upon by the parties involved, has not yet been filed with the court. Given these are large class action lawsuits alleging antitrust violations, numerous hurdles must be overcome. These could necessitate changes to the settlement terms on the path to court approval—if the court approves it at all.
Interview with St Louis Master Electrician Mike Ragan about Aluminum Wiring Concerns
For homeowners in the St. Louis area, this settlement could bring more transparency to the commission structure when selling a home. By removing the requirement for listing brokers to offer buyer broker compensation through the MLS, the agreement aims to give sellers more control over how commissions are negotiated and paid.


 MV Realty Holdings, LLC, a Florida-based real estate company, has recently come under scrutiny for alleged wrongdoing and is currently facing bankruptcy proceedings. The company, which offers homeowners cash in exchange for exclusive rights to list their properties for sale for purportedly a period that lasts forty (40) years, has been accused of deceptive practices and unfair treatment of its clients, including homeowners in Missouri and the St. Louis area.
Leading the pack is zip code 63049 in Jefferson and St. Louis Counties, Missouri, where homes spend an average of only 2 days on the market. Close behind are zip codes in St. Clair County, Illinois (62258) and Madison County, Illinois (62010), with average selling times of 6 and 7 days, respectively.
Fastest Selling Zip Codes In The St Louis MSA


